Regions within the Roman Empire experienced different population growth rates in the last two millennia, due to a wide variety of factors. The purpose of this article is not to discuss these factors but to arrive at estimates that would be useful for genetic genealogists.
Why is it useful for genetic genealogists? Say for example, we have four clusters of men who descend from a common ancestor, Haplogroup XXX, who lived in Roman times. In each cluster we have two distantly related men, let's assume their ancestor lived just a few generations after the XXX man lived. In each case let's assume we are lucky that each cluster is geographically consistent - in two clusters both men trace descent to Baden-Württemberg and the other two clusters are Italian.
Did the ancestor more likely live in Baden-Württemberg or Italy?
Country and regional level sampling rates are important to take into account. I've already compiled country-level sampling rates. Italy has about 1.5 times as many samples on the YFull tree than Germany per capita based on current population. Looking at this on face value tilts the scales slightly toward Baden-Württemberg.
However, Baden-Württemberg appears to have grown in population in the last 2000 years vis-a-vis Italy by a factor of 2.2 to 2.9. This means that for each man who was living in these regions back then, he would have about 2.2 to 2.9 times as many living descendants if he had been living in Baden-Württemberg relative to if he had been living in Italy (and in both cases if the descendants stayed in these regions - which of course was not always the case).
To more comprehensively interpret the sample distribution, multiply the growth rate with the sampling rate. We now have Baden-Württemberg with a two-thousand-year-growth-rate-adjusted-regional-sampling-factor of 2.2 to 2.9 relative to Italy at 1.5. This makes Haplogroup XXX look more likely to be of Italian origin because the higher sampling rate of Italy was more than offset by the higher population growth rate of Baden-Württemberg in the last 2000 years.
Of course with a small number of samples and given holes in testing, we cannot be sure of the true origin even having performed all these calculations. However in clades with many separate lineages which are geographically disparate, I hope that these considerations can help steer researchers into the right direction with their interpretations.
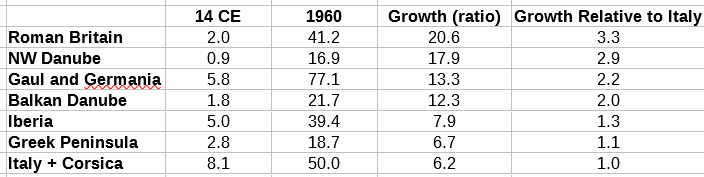
The 14 CE estimates come from Bruce Frier except for Roman Britain, NW Danube and Balkan Danube. Roman Britain figure of 2 million from Mattingly, David (2007). An Imperial Possession: Britain in the Roman Empire, 54 BC – AD 409. Penguin UK. ISBN 9780141903859.
Bruce Frier gave a total of 2.7 million for Danube Region in 14 AD. He defines this as generally south of the river Danube. Includes the Roman provinces of Raetia, Noricum, Pannonia Superior, Pannonia Inferior, Illyricum (or Dalmatia) and Moesia (Superior and Inferior). Parts of modern Switzerland, southern Germany and Austria, western Hungary, Slovenia, Croatia, Bosnia, Montenegro, central Serbia and northern Bulgaria.
I do not have access to 14 CE population estimates within each province of the Danube Region. However, if we work backward from 1960 populations we get the unlikely figures that 44% of the population of this entire region was living in Raetia and Noricum plus the rest of Austria (1/3 of BW, 1/2 of Bavaria, eastern half of Switzerland, and for simplicity all of Austria) and just 56% were living in the rest.

Because I think they each experienced significantly different growth rates, I adjusted the 14 CE population of the NW Danube and Balkan Danube regions to reflect 35% and 65% respectively of the Danube Region total.
This is because:
- Relatively larger number of Roman cities along the Adriatic coast compared to the those in Raetia and Noricum and the rest of Austria
- NW Danube zone has more frontier and would have seen less intra Roman commerce
- NW Danube zone industrialized prior to the Balkans
This modest recalibration results in 46% increased growth for NW Danube compared to Balkan Danube over the last 2000 years. Maybe a more drastic reallocation is needed, but I lack the expertise to make such a call.
I am not a historian and did not spend a lot of time mapping the boundaries of the provinces of the Roman empire onto modern countries. In general I eyeballed what proportion of a modern country or state fell within the Roman region, using halves and thirds. For example, I counted Bulgaria 1/2 for Greek Peninsula and 1/2 for Balkan Danube. Switzerland counts 1/2 for Gaul and Germania and 1/2 for Balkan Danube.
The complete set of calculations behind this chart -> Population Growth Since Rome
Because these calculations are based on my rough estimates and scholarship that is based on not certainly known ancient populations, take these figures as a rough guide.
Anyone with more expertise is welcome to expand on this work or suggest a different original population ratio for the two Danube Zones. Just plug in your different numbers and the spreadsheet will recalculate growth rates relative to Italy.
Additionally there are other factors which contribute to population change, such as mass migrations from one region to another in the last 2000 years, that are not taken into account. Anyone able to take this and additional factors into account is welcome to do so. I hope this simplistic approach provides some value without being too complex.