 Heatmap
The frequency heatmaps are computed in the browser using a Leaflet Heatmap plugin called heatmap.js.
Samples
A big thank you to YFull for granting permission to use their samples to compute the heatmaps. I have also included some additional ancient samples not yet on the YFull YTree.
I hope that this new heatmap functionality will kindle an interest in haplogroup researchers to contribute ancient samples from their haplogroup which are not on the YFull tree.
Map and Server
The map is planet.osm from OpenStreetMap. The tile server is hosted by YSEQ.
Geocoding
I assign each sample on the YFull tree a latitude and longitude based on two tsv files I maintain on github at frequency-heatmap. Country codes are mostly ISO3166-1 Alpha 3 codes with the addition of several ethno-regional codes used by YFull. Country-region codes are largely ISO-3166-2 with the addition of Chapman codes. I generally use a geographically central location to represent a country or region, though not all shapes yield obvious centers. With each YFull update I add locations for newly encountered codes. I occasionally uncover errors from reverse-geocoding - please contact me if you encounter an inaccurately geocoded country/region.
Methodology
I approximate relative frequency by applying a weight to each sample that is the inverse of the sampling rate [across the whole YFull tree] at that sample's location. Otherwise you would see a frequency map, subject to population density effects, rather than a relative frequency map.
To compute the world regional sampling rate, I create a Gaussian distribution around each geolocated sample.
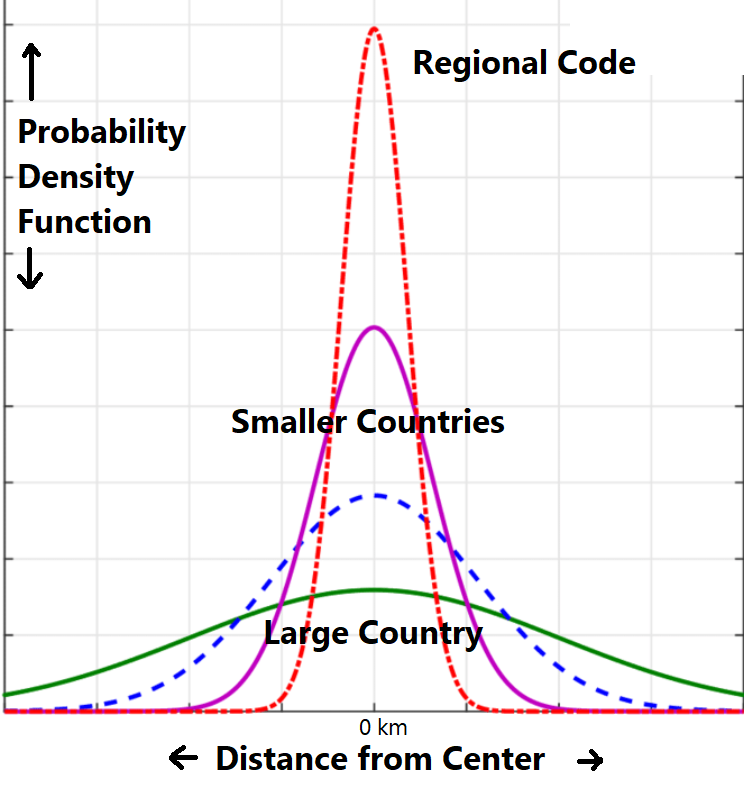
Samples with regional specificity are distributed about their center with standard deviation of 100 km. Samples specific only to the country level are given larger distributions [sqrt(area) up to a maximum of 1000 km] with lower intensity at any given point, reflecting the uncertainty of any given location within a larger area. The overall weight of each point is kept equal by dividing by a constant in the probability density function.
Code is in the same library linked above.
New World vs Old World Haplogroups
There may be some unexpected effects in New World haplogroups because I'm currently using the complete set of all geocoded YFull samples to create the world regional sampling rate while the samples passed to create a haplogroup's heatmap view itself undergoes a filtering designed to not throw off the PhyloGeographer algorithm for indigenous New World haplogroups.
This will be addressed in a future update.
Limitations of Leaflet Heatmap Plugin
The heatmap plugin computes an approximate frequency heatmap efficiently in the browser by dividing a sample's weight by the overall sampling rate computed at its exact position. To compute an exact relative frequency requires taking into account the sampling rate of surrounding locations, which may differ - a sample would skew more strongly over less-sampled regions that are equidistant from more highly-sampled regions. This behavior is not possible to compute in the leaflet heatmap as it models each sample as a point whose distribution is spread equally in all directions.