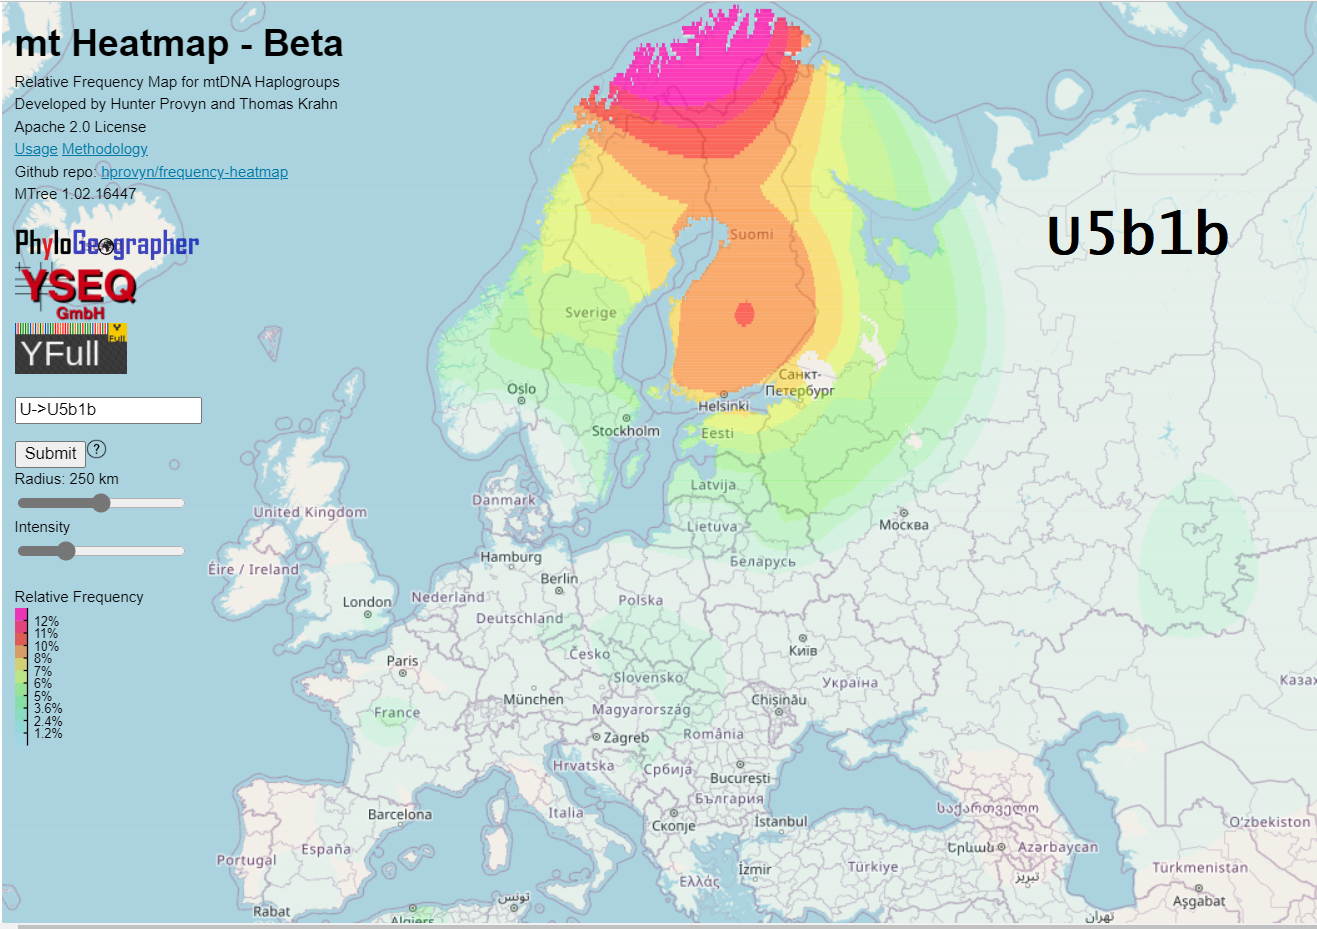
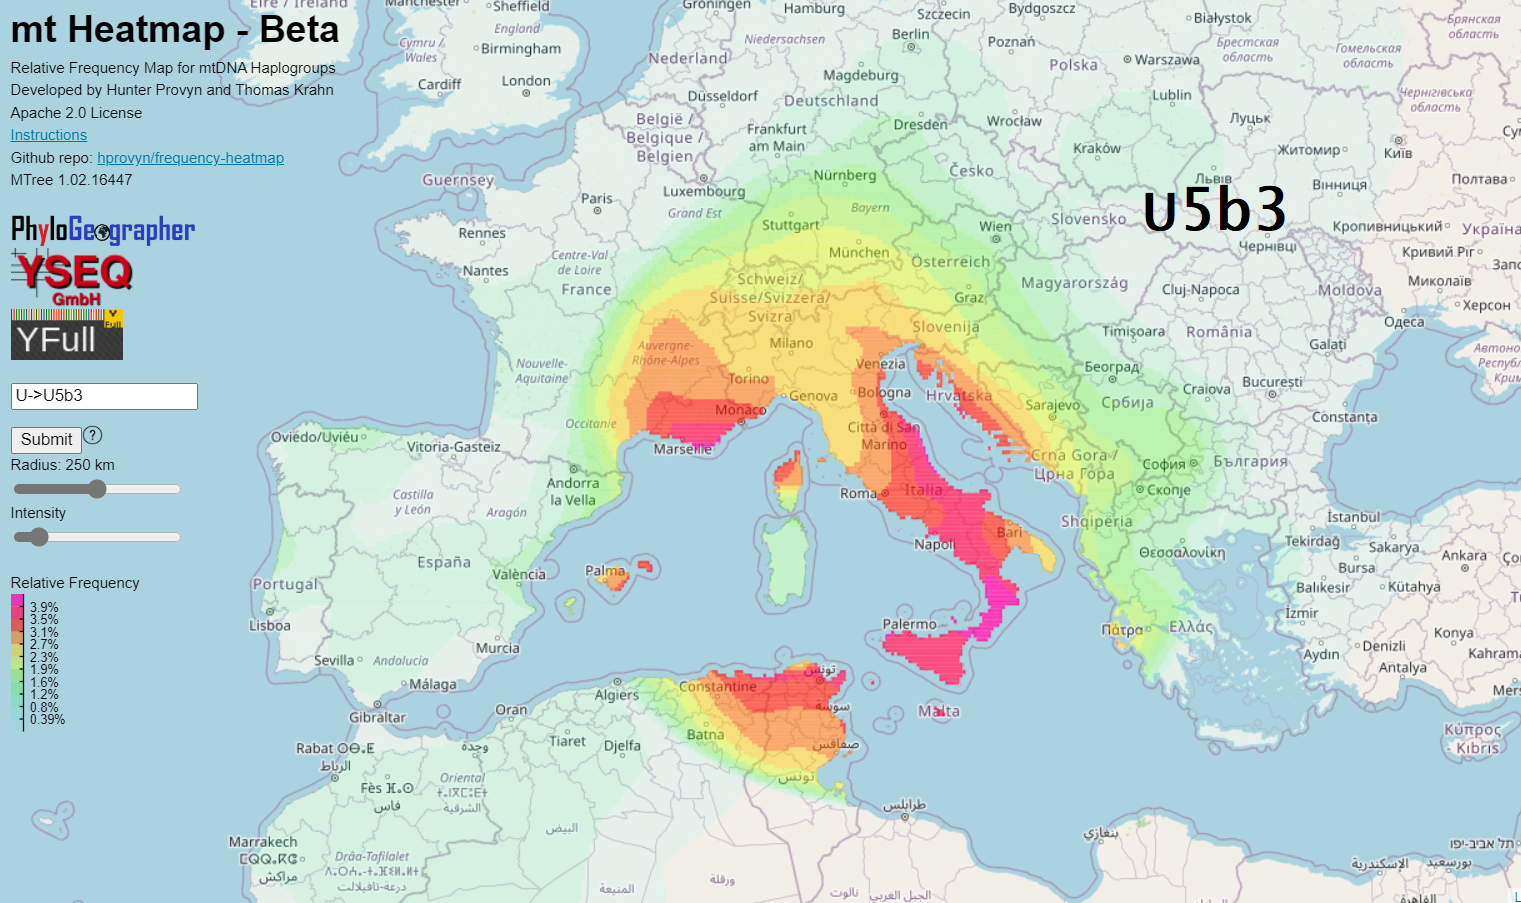
mt Heatmap depicts the relative frequency of mtDNA haplogroups across the world, as computed by geolocated samples on the YFull MTree. The software was developed by me, Hunter Provyn, in collaboration with Thomas Krahn of YSEQ.
The relative frequency calculation is more precise than what was possible in the original Beta version of Y Heatmap because I have now written my own software to compute and depict the relative frequency rather than rely on the heatmap.js plugin that, while very effective and performant, had certain limitations and that I didn't know how to re-engineer.
How to Use It
Go to mt Heatmap.
Be patient while two relatively large files are automatically loaded by your browser. Your browser can later get it instantly from your cache depending on your browser settings.
Start typing the name of a SNP or mtDNA haplogroup.
Some autocompletion helps you find the name of a valid mtDNA haplogroup that you can find and click from the drop down list.
Otherwise, if you type the full name of the haplogroup (including root prefix you can see in the drop down) you can then click the "Submit" button. If that haplogroup is unrecognized you will see a warning message.
If you zoom in far enough you will see the markers representing individual samples.
Please note that these locations represent a sample's geography only to the specificity of the regional code that they have marked the sample with on YFull MTree. I do not have access to exact latitude and longitude that a sample has entered into YFull. If I get access then the heatmaps will be more accurate.
If you change to a new radius for the first time, it will take a few seconds to load the pre-computed denominator (world sample rate) for that radius. In the future your browser can get this from the cache.
The Maths
I maintain a mapping of each geocode from the YFull YTree and MTree to a single latitude longitudinal position, generally central to the shape of the administrative region.
For performance reasons, a triangular distribution is used to compute the frequency surface. This type of distribution decreases intensity linearly from the center out to a fixed radius where it becomes zero.
Samples with a geocode corresponding to a larger region are represented with a relatively larger radius.
Any region under 10,000 km2 has a fixed, minimum radius, which the user can toggle between 200 km, 250 km or 300 km.
Any region greater than 2.25 million km2 has a radius that is ten times greater than the minimum.
Any region between 10,000 km2 and 2.25 million km2 has a radius between this minimum and maximum that is linearly proportional to the square root of its area.
In order to avoid excessively large radii for countries larger than Algeria, I transformed the relative square root of regions area scale from 1-15 (i.e. smallest region gets a 1 and largest get 15) to down to 1-10 for the actual radius applied on the map.
The formula to translate from the 1-15 scale linearly to the 1-10 scale is f(n) = (n-1)/14*9+1
Why Relative Frequency Percentages in mt Heatmap are more Accurate than previous Y Heatmap Beta
The major drawback of the heatmap.js plugin that Y Heatmap and Diversity Map - Beta use, is that it does not support dividing a target haplogroup frequency over a map by an underlying overall sample rate frequency.
As a workaround, I assigned a weight to each sample that was the inverse of the sample rate of the exact position of the sample and supplied these sample-rate adjusted weights to heatmap.js.
This resulted in the best approximation of relative frequency I could compute given this limitation. The major limitation was that heatmap.js made each sample contribute effective relative frequency radially equally, regardless to variations of underlying sample rate outside the center in each direction.
So with M Heatmap - Beta, my custom computational code addresses this limitation and actually computes two surfaces. A numerator (target hg) surface is then divided by the denominator (overall sample rate) surface in order to yield a quotient. The quotient surface depicts relative frequency more accurately by taking into account more fine-grained differences in regional sampling rates.
Whole World
Y Heatmap and Diversity Map - Beta relied on files processed by my PhyloGeographer code. As such, to cut down on some potentially significant geographic skewing, I filtered out some Oceania and New World samples for Old World haplogroups. With mt Heatmap I have added no such restrictions.
Interpretation
There are some counterintuitive artifacts of the chosen approach.
Sometimes the greatest frequency of a haplogroup is calculated to be somewhere not in the immediate vicinity any sample's center. This tends to happen more along the coasts of regions over areas where the specific geocode is represented less in YFull. In cases like this, a single sample that is closer to the nearly unrepresented area may contribute a significant amount of signal that is not counterbalanced by more heavily sampled population centers that are more distant.
Holes
My software references the OSM Water Layer to only show frequency over land.
OSM Water Layer is available for download at IIS U-Tokyo webpage: http://hydro.iis.u-tokyo.ac.jp/~yamadai/OSM_water/.
While on the whole I am very pleased with the accuracy of this file, I noticed there were a few mistakes where the code for ocean was used to represent inland freshwater marshes. One such example are two areas to the NE of St Petersburg, Russia.
Please contact me if you spot additional holes. I will fix this problem all at once in a future upgrade.
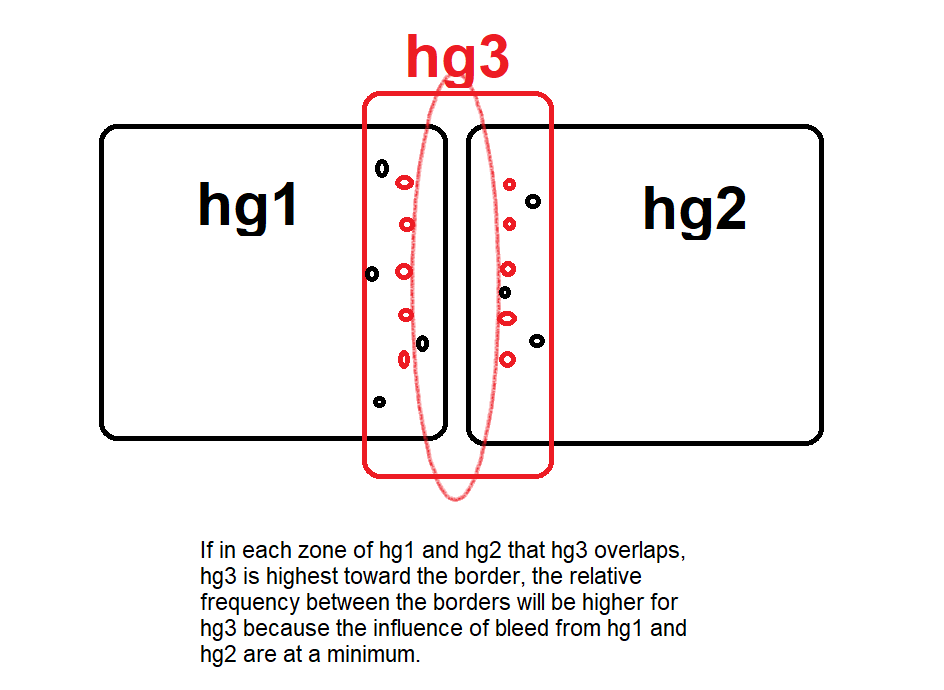
Relative "Holes"
You may see another kind of effect resembling a hole.
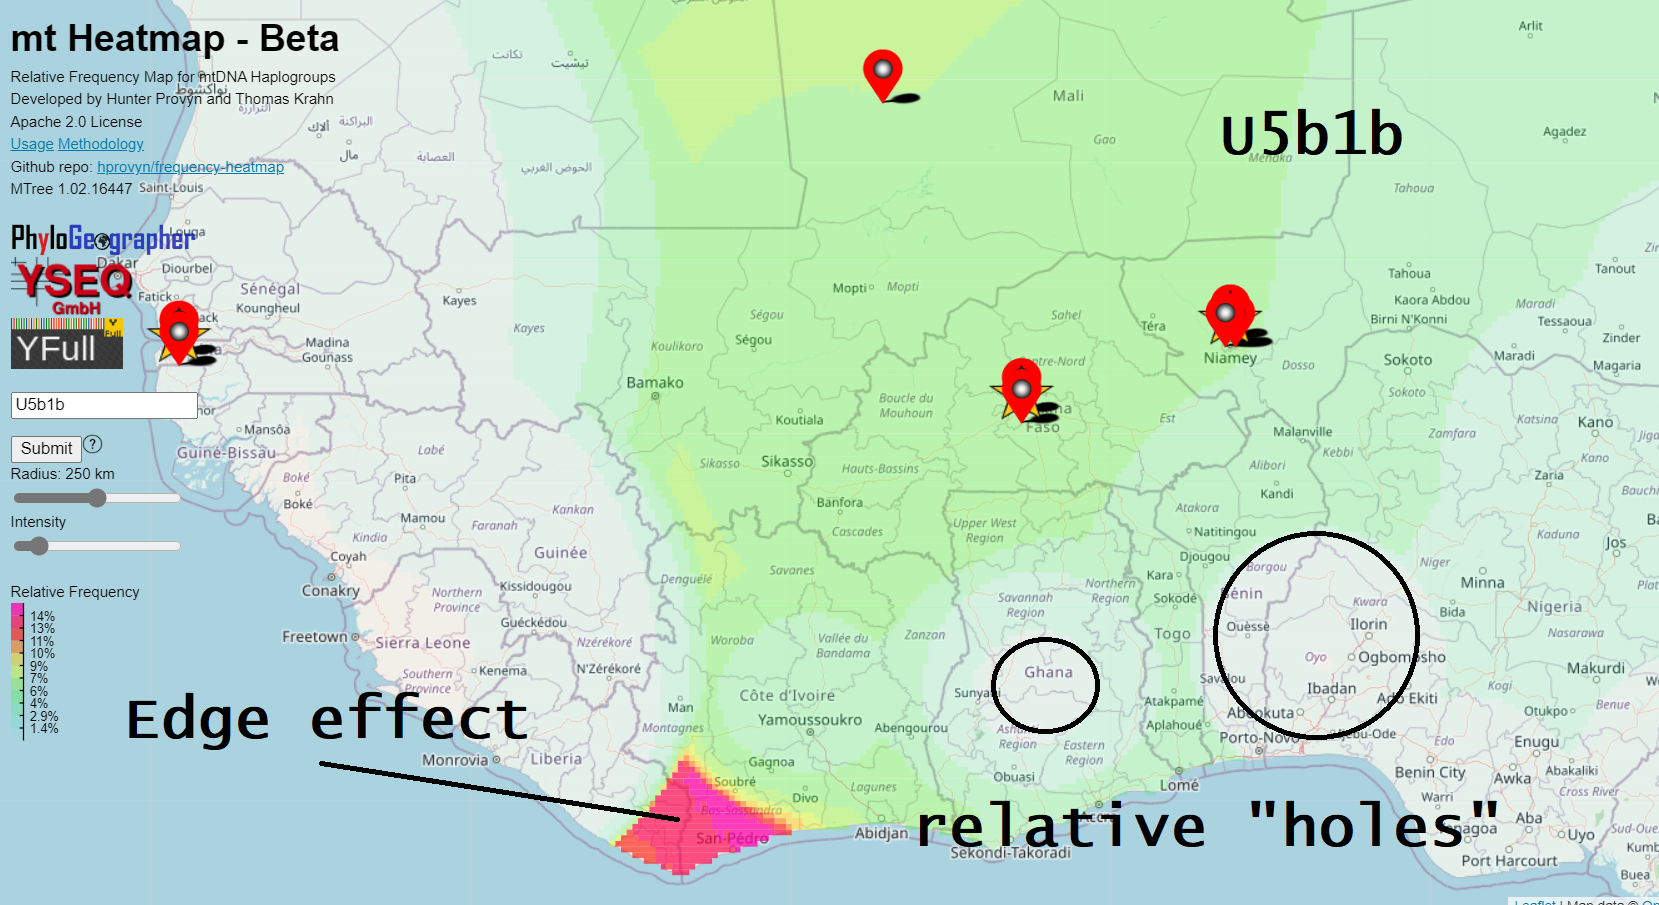
This example depicts two circular holes, one centered around Ghana and the other the Oyo region of Nigeria. These holes are different from the ones caused by mistakes in the water grid file.
In this case the regions are represented in the overall sample rate. The reason for the hole in the U5b1b relative frequency map is straightforward: several samples using these specific regional codes exist in the MTree and none are the haplogroup U5b1b.
As far as we know based on the samples on MTree, maybe there are no U5b1b there, or less than in neighboring regions. In this case it could simply be an artifact of lower sampling rate in this part of Africa.
The edge effect between Liberia and Cote d'Ivoire is likely caused by the single Mali sample being one of very few regional codes on the MTree that reaches into this area. Mali is the 8th largest country of Africa so the effective radius is larger.
While it looks odd keep in mind this particular instance is not very severe, the frequency there is computed at roughly twice the relative frequency of surrounding areas.
Future Enhancements
- Speed
- I will work to increase the speed by reducing the size of required files
- Filtering
- Filtering to only compute frequencies for the set of samples of a certain age. For example, 1-2000 CE, 2000-1 BCE, 4000-2000 BCE.
- We may not yet have enough ancient samples tested to create definitive frequency maps across ancient time ranges but this is where we are headed.
- Automatically generated title
- I usually use MS Paint to add titles to frequency map screenshots because the text in the legend ends up being too small if you don't view the map in full screen. This could be automated or added by a button.
Hi Hunter Provyn
Your heat maps load with the world map on android phones but are apparently not loading on any pc.
What should I do?
Thanks
Hi Joyce, thanks for bringing it to my attention. We fixed this issue a few weeks ago.