Ok I understand how to use it - Take me to the Heatmaps!
How do I use it?
Enter your SNP without the haplogroup prefix and hit enter or click the button.
The following haplogroup roots are also supported, typed in exactly as depicted here:
A00, A0, A1a, A1b1, B, C, D, E, G, H, I1, I2, J1, J-M102, J-M241, J-M410, J-M205, J-Z2453, L, M, N, O, Q, R1a, R1b, R-M269, R-L23, R-L51, R-L52, R-L151, R2, S, T
Support for automatic redirecting to hg specific SNP (for SNPs in multiple haplogroups) is in development.
Q: My SNP didn't load anything.
A: This tool only supports SNPs on the YFull tree with geolocated samples.
Check if your SNP is on the YFull tree.
For missing SNPs or to get more of your relatives' geographic distribution on the heatmap, recommend men who have tested WGS or Big Y to do the YFull analysis.
For $49 they get estimates of when their most recent common ancestor with men on the YFull tree lived. For my haplogroup research, J2b, we rely on the YFull tree because it's the only tree that contains samples from all testing companies, including many samples from scientific studies conducted in otherwise undersampled regions.
Q: Is the highest intensity area the origin of the haplogroup?
A: Possibly but not necessarily.
A relative frequency heatmap is just that - it isn't implying any theoretical migration between points but a haplogroup researcher may be able to draw certain conclusions based on their deeper knowledge of upstream and related lineages.
A relative frequency heatmap may be able to provide a better understanding of the approximate origin of a subclade that has many samples, some of which are in more heavily sampled regions, some in less sampled regions.
Because regional sampling rate has been factored out of the equation, you can look at the map to get a better idea of the true relative frequency of your lineage than you would be able to from just looking at a list of samples on a tree and doing a daunting amount of mental math.
Understanding Founder Effects
One important pitfall to avoid are founder effects.
This is when one man, many years after the founding of the subclade you are looking at, had a multitude of sons. The sheer number of this mans sons can make the relative frequency for where they live higher than the actual origin of their more distant ancestor.
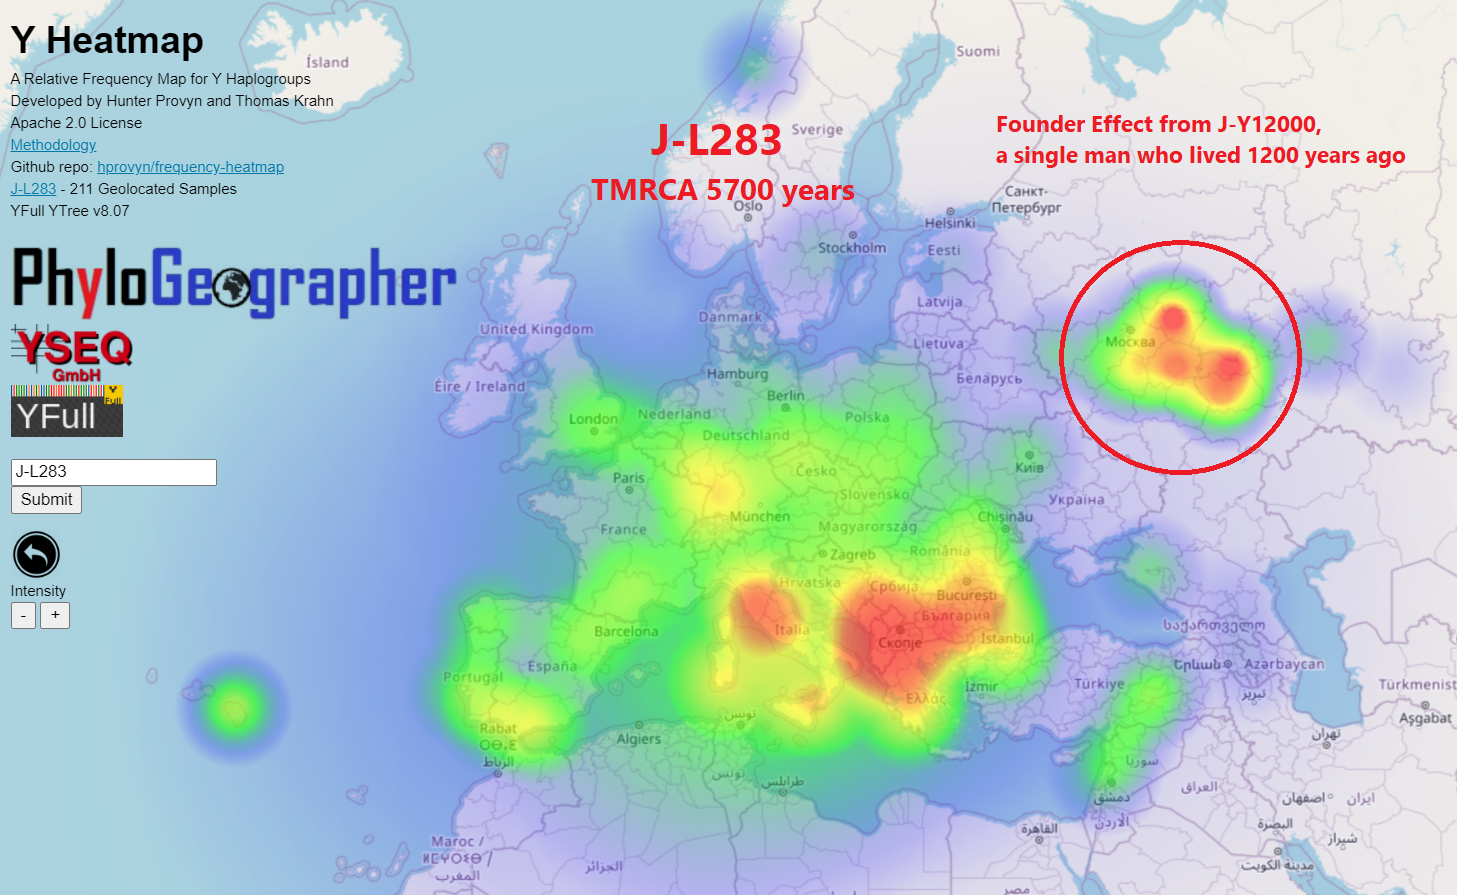
My haplogroup J-L283 has a relative high frequency around Mordovia due to a single man having migrated there around 1200 years ago. Their descendants are now Mokshas and Mishar Tatars.
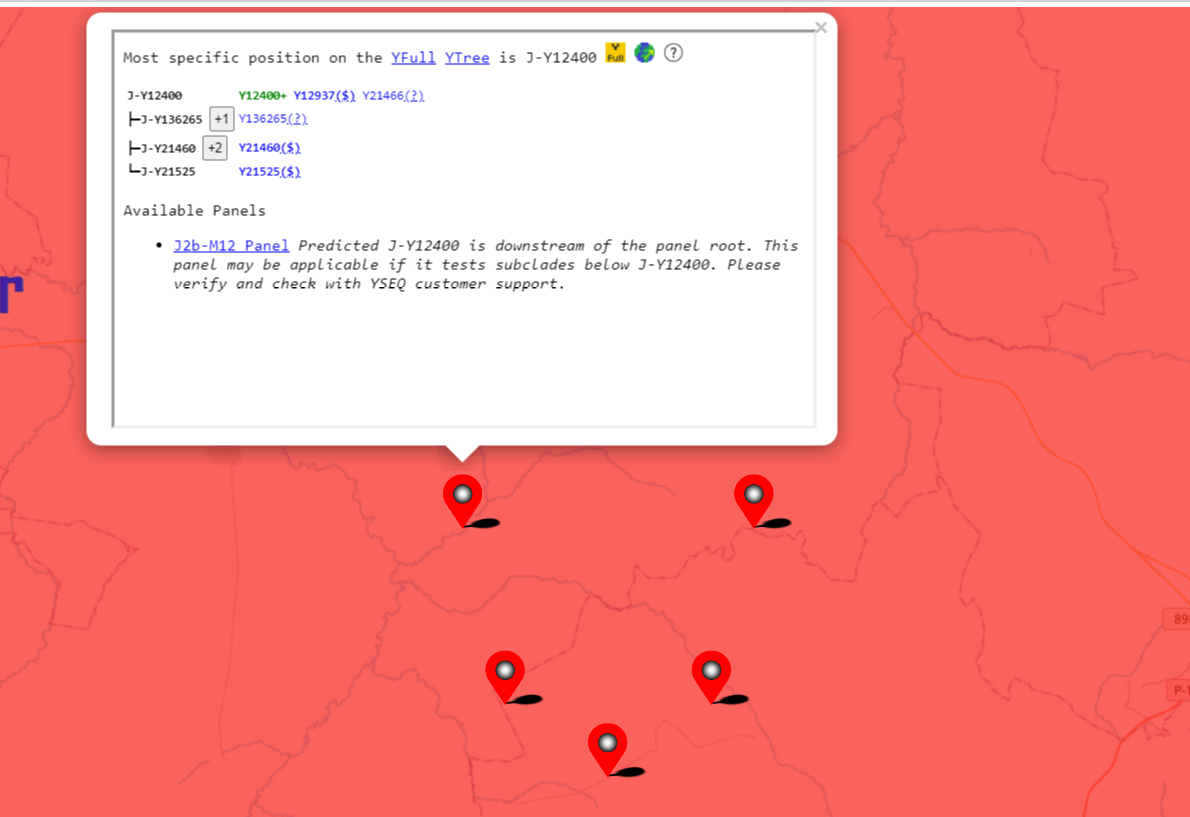
Recognizing Founder Effects
It's not possible to determine founder effects by simply looking at the frequency heatmap absent knowledge of the samples.
To identify a possible founder effect in your haplogroup, zoom in to see the individual samples. Click on the samples to see their position on the YFull tree. You are looking at a founder effect if all the samples are below one particular lineage of your haplogroup.
Founder Effect is Obscuring My Haplogroup
An extreme local maximum caused by a founder effect can sometimes result in other samples contributing a very faint, near invisible blue. To make the regional differentiation of these fainter areas clearer, increase the intensity.
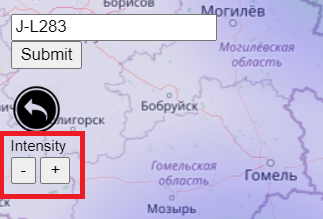
Note that, as you increase the intensity, more areas of the map will depict the same red hue though they are not truly equal in relative frequency. This is fine if you don't care about that and are more interested in seeing regional differentiation elsewhere.
A Type of Heatmap Free of Founder Effects
I have an idea for a different type of heatmap calculated almost the same as a relative frequency heatmap but that gives samples under each sibling equal total weight. This would no longer be a true relative frequency heatmap but would be immune to founder effects.
Q: A sample from one region is contributing much more intensity than the others. Is this a bug?
A: No, assigning samples from less sampled regions higher weight is NECESSARY in order to calculate a relative frequency heatmap.
If each sample is given the same weight, the result is not a relative frequency heatmap but a frequency heatmap. Frequency heatmaps will have higher intensity in areas where people live and do not depict the true relative frequency of a haplogroup, which is more interesting to know.
For a rough of idea of how all samples are weighted, refer to the YFull World Sampling Rate Map I created and update every month.
Hovering over Austria and India you can see India is sampled at over 6 times less per capita.
So one Indian, on average, equals about six Austrians.
Low Sample Size?
If you don't have very many samples you will have a less reliable relative frequency heatmap. To go up a level in your tree, hit the back button below the text input field.
Thank You
Thank you to YFull for letting me use their tree and samples to compute the heatmaps. Thanks all the YFull customers for having tested and for contributing to public haplogroup research.
Special thanks to Thomas Krahn of YSEQ whose idea it was for me to create the heatmaps and who has provided significant ideas and financially supported the development.
If you appreciate the tools / free services I am creating for genetic genealogy consider testing with YSEQ. Or if you are already a satisfied customer, consider recommending their services to your friends. With the recent introduction of Clade Finder, all YSEQ haplogroup panels have become continuously updated based on the monthly YFull YTree updates. You'll be tested down to the most recently discovered and testable SNP.
The YFull YTree is the tree of mankind. The more who test and get on this tree, the greater our knowledge of where our ancestors lived and how we are all related to one another.