This page describes the new Diversity Heatmap tool.
What is the difference between the Diversity Heatmap and the Frequency Heatmap?
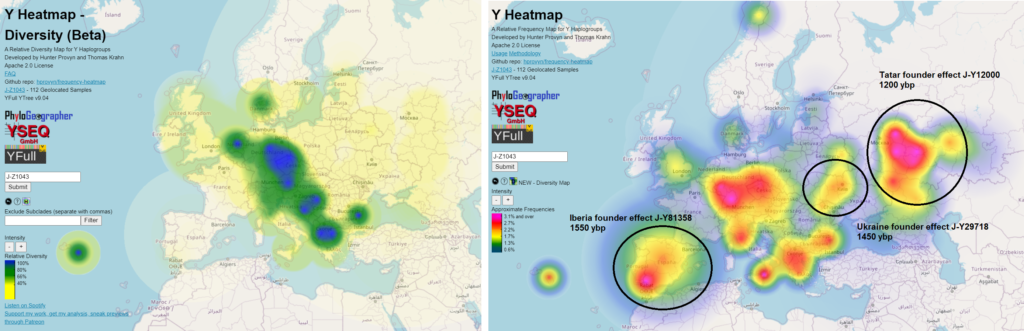
In the summer of 2020 I released the Frequency Heatmap version of Y Heatmap.
A frequency heatmap shows the percentage of people living today who are positive for a haplogroup in a given region.
A diversity heatmap shows you the regions where more of a haplogroup's immediate child lineages have presence, regardless of whether or not it is found there at a high rate among the modern population.
Why do I need a Diversity Heatmap?
A diversity heatmap is usually a better indicator of the geographic origin or later comigration of a haplogroup's founder than a frequency heatmap because the diversity heatmap is immune to founder effects seen in the frequency heatmap.
One strategy to use is to find the areas exhibiting both high diversity and high frequency and to consider those areas as candidates of the true origin or comigration terminus.
A founder effect is when a descendant line sires relatively more offspring lines than most branching points have (relative to regional sampling rates), especially in an area not believed to be the deeper origin of the haplogroup.
If this descendant had been living in an area peripheral to where his more distant male line ancestors had originally been living, his large number of offspring could result in a relative frequency heatmap of the entire haplogroup showing higher frequency in the peripheral area where the founder lived than around the true origin.
Is one of the highest diversity areas guaranteed to be the geographic origin of the haplogroup's TMRCA?
No.
Keep in mind that either heatmap is not guaranteed to show the true origin of a haplogroup. For example, in cases where the lineage did not survive where it had originated, everyone migrated away, or people living around the true origin have not been tested and analyzed on the YFull tree.
It makes sense to use knowledge of historical demographic movements and ancient samples to guide your interpretation.
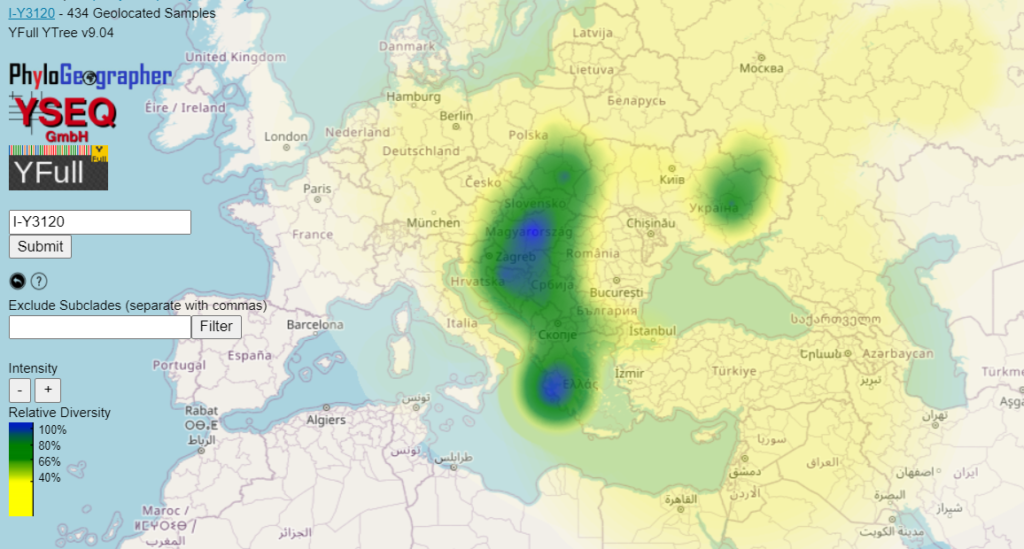
For example, some of the subclades of I2-Y3120 have high diversity around Noricum, Pannonia, and the western Balkans. Some of these subclades have TMRCAs that lived a few centuries before the Slavic migrations. If their ancestors had really been living in Noricum and Pannonia 2000 years ago, before the Slavic invasions, then we would expect to see more of them having been recruited and displaced by the Roman Empire like we do with indigenous western Balkan subclades such as J2b-L283. So in this case I think it makes sense to interpret the high diversity in this regions as the result of massive comigrations from elsewhere.
Why is a Diversity Heatmap immune to Founder Effects?
A diversity heatmap is immune to founder effects because each branch allocates the same total weight to each of its children, each piece of which is then divvied up and allocated equally to each of that branch's children and so on.
How is a sample's weight calculated?
There are three different weights applied. The first two are the same as in the Frequency Heatmap.
- Geographic specificity weight - more precise geocodes result in tighter distribution, less precise results in larger distribution at lower intensity
- Regional sampling rate - the more total samples in a region, the less each sample from there counts
The third weight is a branch-specific diversity weight. Samples further down the tree from the haplogroup root get less and less weight. This ensures that any two sibling samples/lines will always be given the same total weight relative to each other.
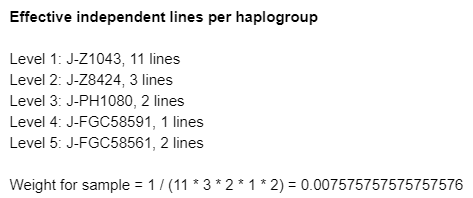
If a founder effect resulted in 20 different geocoded children samples / children lines, each of the twenty would be worth just 1/20th of whatever that subclade would have been worth. So if the sibling of that subclade was just a single sample, his branch diversity weight would be twenty times as much as each of the children of his siblings.
The calculation of the branch-specific diversity weight is displayed by clicking the sample. Here is mine.
How can I interpret the display?
The way I have calculated diversity is unitless. One place has more or less diversity than another.
Important! - Because there is no color above blue, it is possible that some areas of intense blue are significantly more diverse than others. Be sure to read the next question about how you can change the thresholds to have a more meaningful diversity heatmap.
Areas that are the most intense shade of blue have at least 25-50% more diversity than areas that are the most intense shade of green and at least 2.5 times the diversity of yellow. I calculated this by dividing 100% by the interval representing the most intense green (80%-66%).
Areas that are the most intense shade of green have 66%-100% more diversity than the completely yellow areas on their immediate periphery.
Blue-green and green-yellow are continuums representing at their midpoints (which may be hard to exactly discern), 90% and 53% of the diversity indicated by pure blue.
The lower the diversity, the more translucent the coloring.
What happens when I click +/-?
A default maximum threshold is automatically computed for a given haplogroup that determines what areas will be shown as blue (100%).
As there is no color above blue, some areas of this most intense blue may be significantly more diverse than others.
The default surface (mathnerd speak for the colors on the map representing different values) that is initially displayed may or may not be useful for your research purposes.
You can (and should!) toggle the intensity up or down by clicking +/- in order to have a more meaningful diversity heatmap.
Beta Release Notes
One noteworthy deficiency that will be addressed by the next YFull update concerns the treatment of samples of uncertain terminal subclade on the YFull tree.
These samples are designated with an "i" on the YFull tree and a note listing the possible terminal subclades that the sample could be, on the basis of negatives.
I plan to treat such uncertain samples with a probability distribution reflecting the actual counts of samples in each of the possible subclades indicated.
Because I need to rewrite some of my YFull data processing functions I will hold off on implementing this improvement until YFull v9.05.
How are non-fully basal samples treated?
Some samples on the YFull tree lack coverage for an exact placement in one branch.
These samples are designated with an "i" on the YFull tree and a note listing the possible terminal subclades that the sample could be, on the basis of negatives.
I've introduced new logic for handling this samples that will go into effect with YFull release v9.05.
Each such sample, which I refer to as an "incomplete basal", will be considered as representing each possible subclade according to a probability distribution that is determined by the numbers of independent lines of each possible subclade. The more independent lines of a subclade, the more the sample will be considered to represent that subclade.
Zooming in and clicking the sample will show a marker explaining the calculation and the conditional weights for each possible subclade that were summed to get the total weight.
Note that this is not the final weight applied to the sample, but is the weight according to diversity. This is multiplied by a regional sampling factor and a factor relating to regional specificity (less geographically-specific samples represent a wider area at less intensity) to determine the final weight.
If you finished reading all the FAQs you are ready to check out the tool - Diversity Heatmap